Portfolio
Data is fun.
Fertility Trends in Canada: Example Report
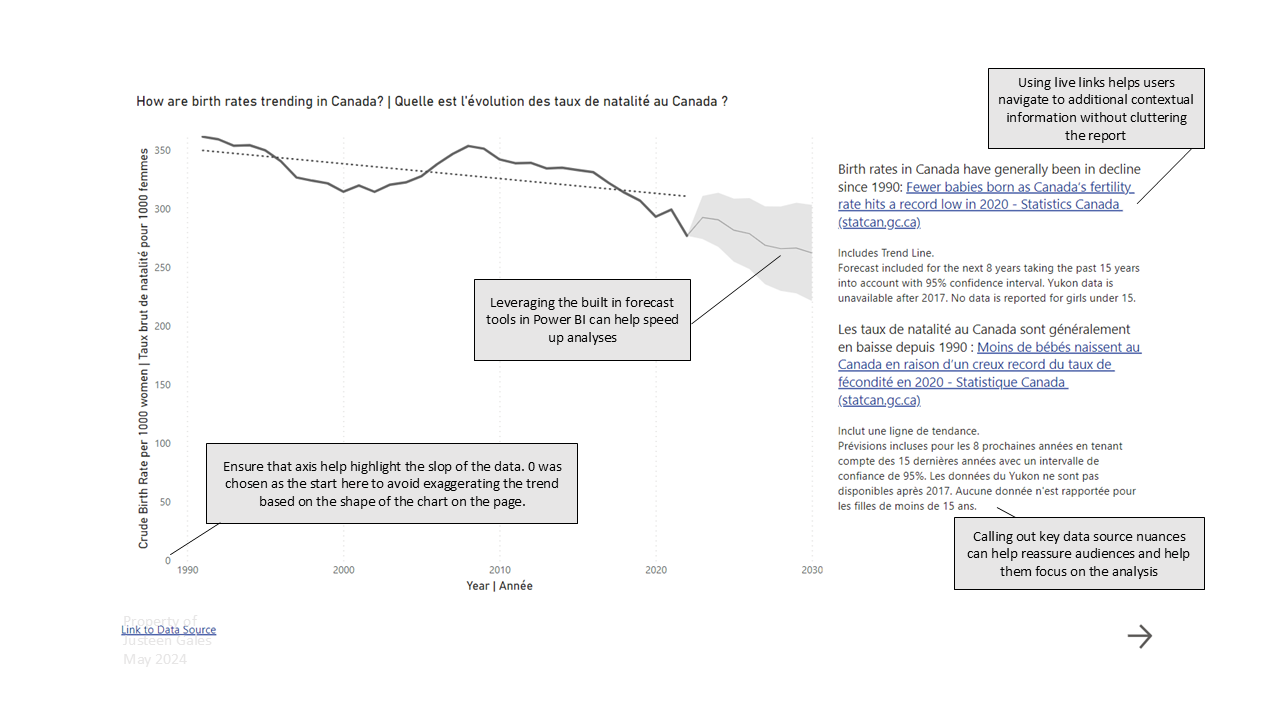
An analysis of regional trends across Canada with tips and tricks for Power BI developers to share with their audiences.
Check it out ↗
The Data Blog
Featured


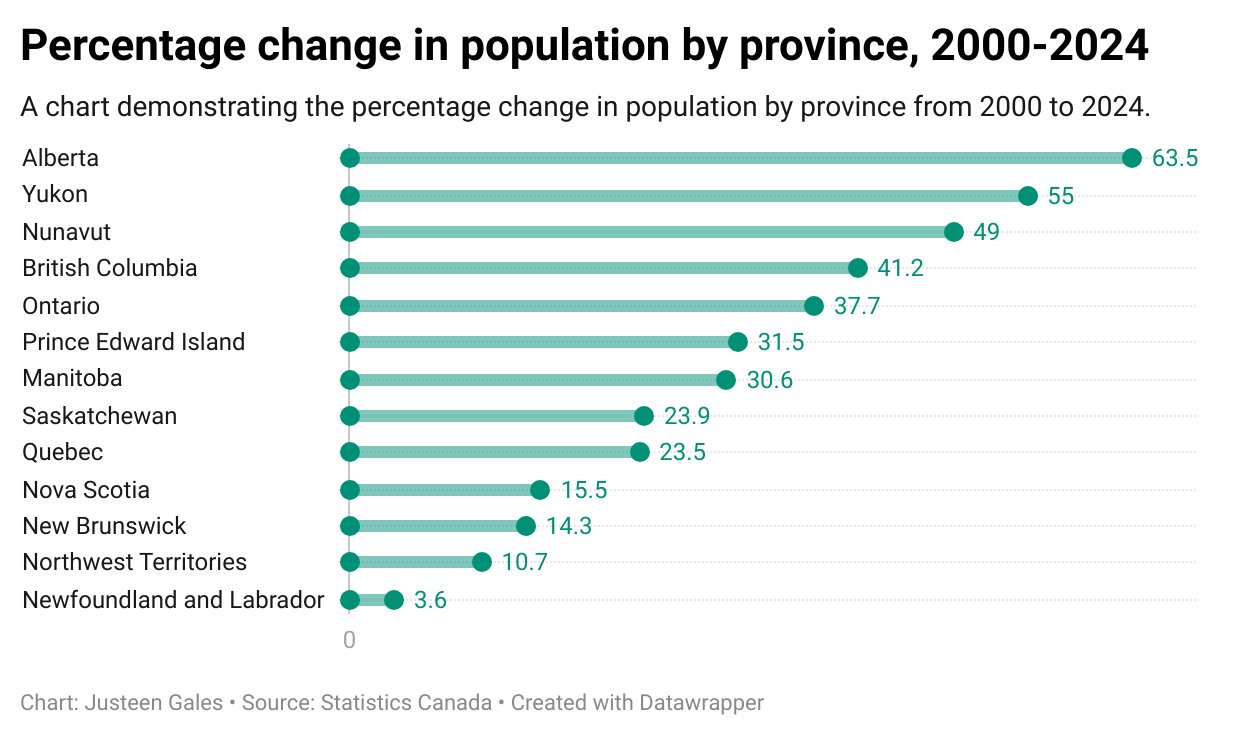
Visualizing Population Changes in Canada
Exploring how the same data can be displayed in many different visualizations. Which one do you think is the most effective?
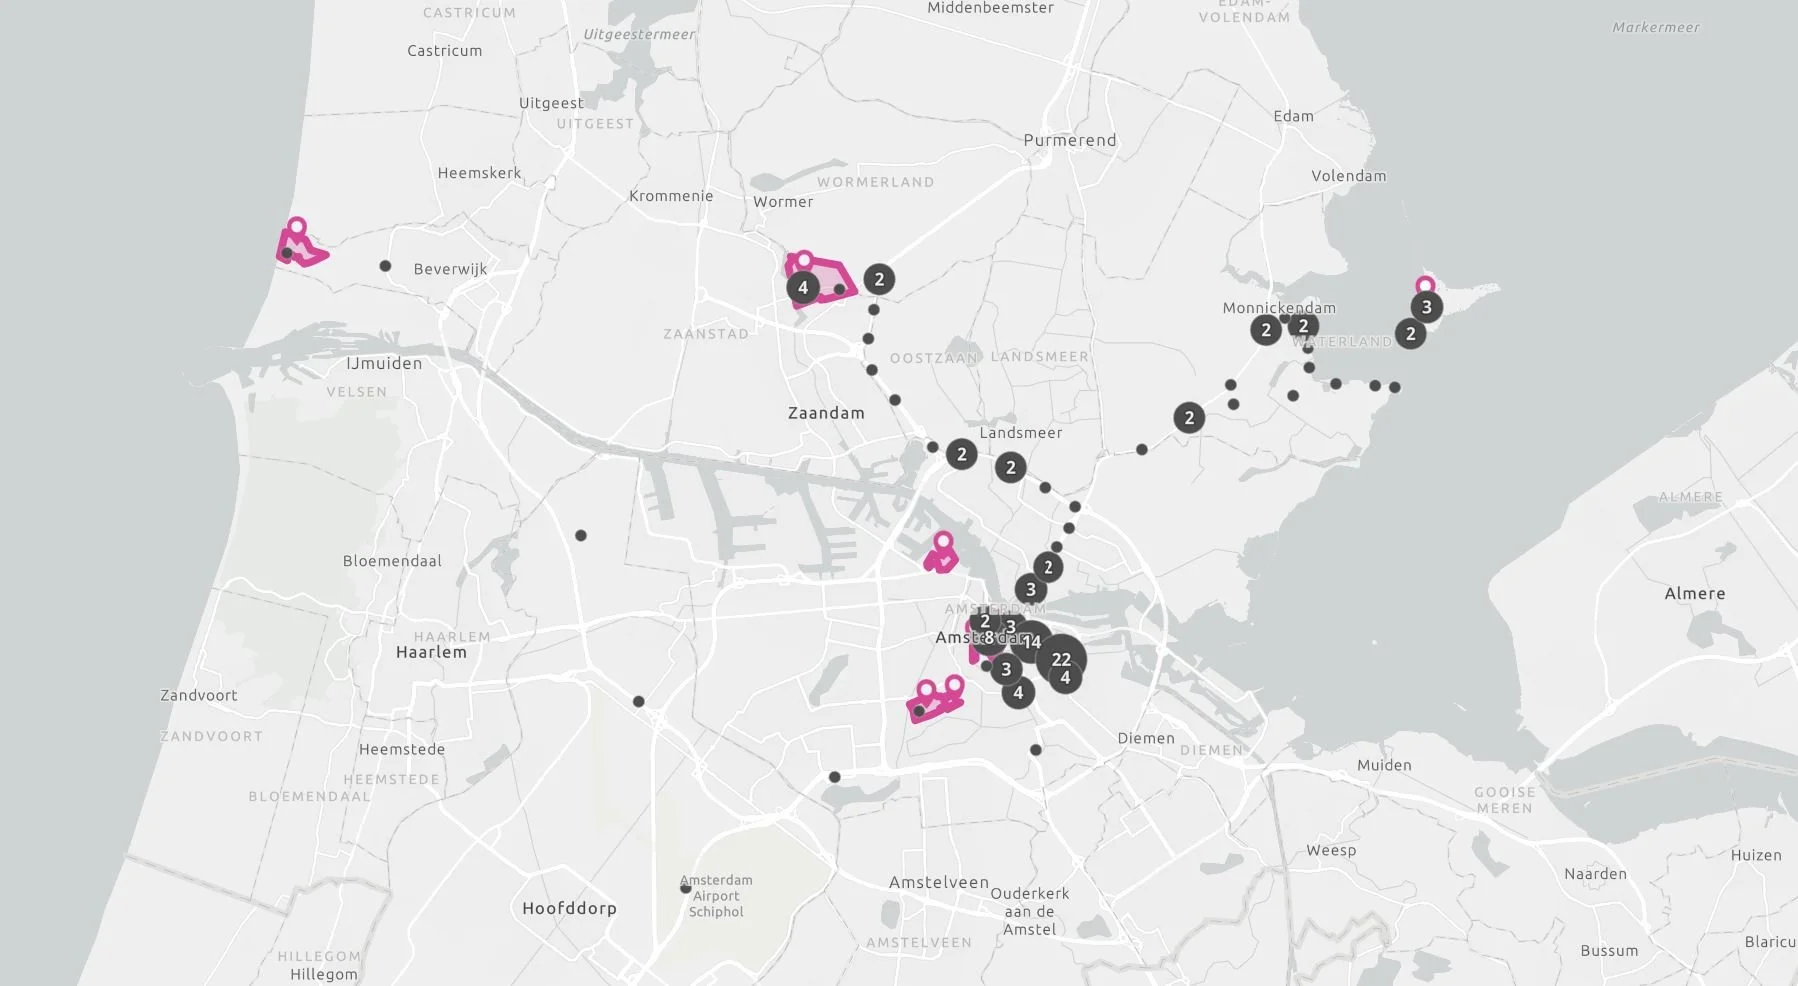
Basic GIS Mapping
A mapping project for the “Introduction to GIS: Geospatial Analysis” course provided by Seneca College demonstrating abilities to build Field Maps forms, gather GIS data in the field and use ArcGIS Online tools.