Bilingual Fertility Rate Analysis Report
A static view of a Power BI report with callouts demonstrating the different functionalities used to visualize the data.
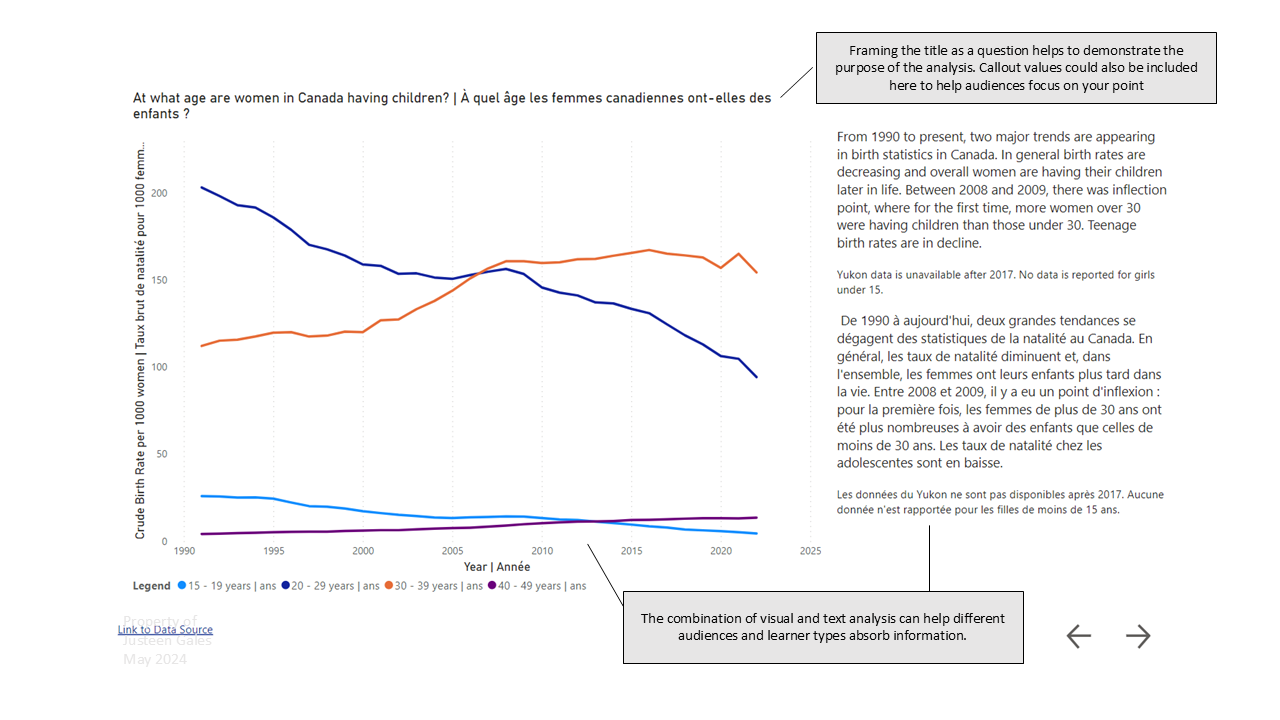
In 2024, I had the idea to explore Statistics Canada data related to fertility rates in Canada. The data is of interest to me, and relevant, as fertility rates have declined to their lowest point in Canadian history.
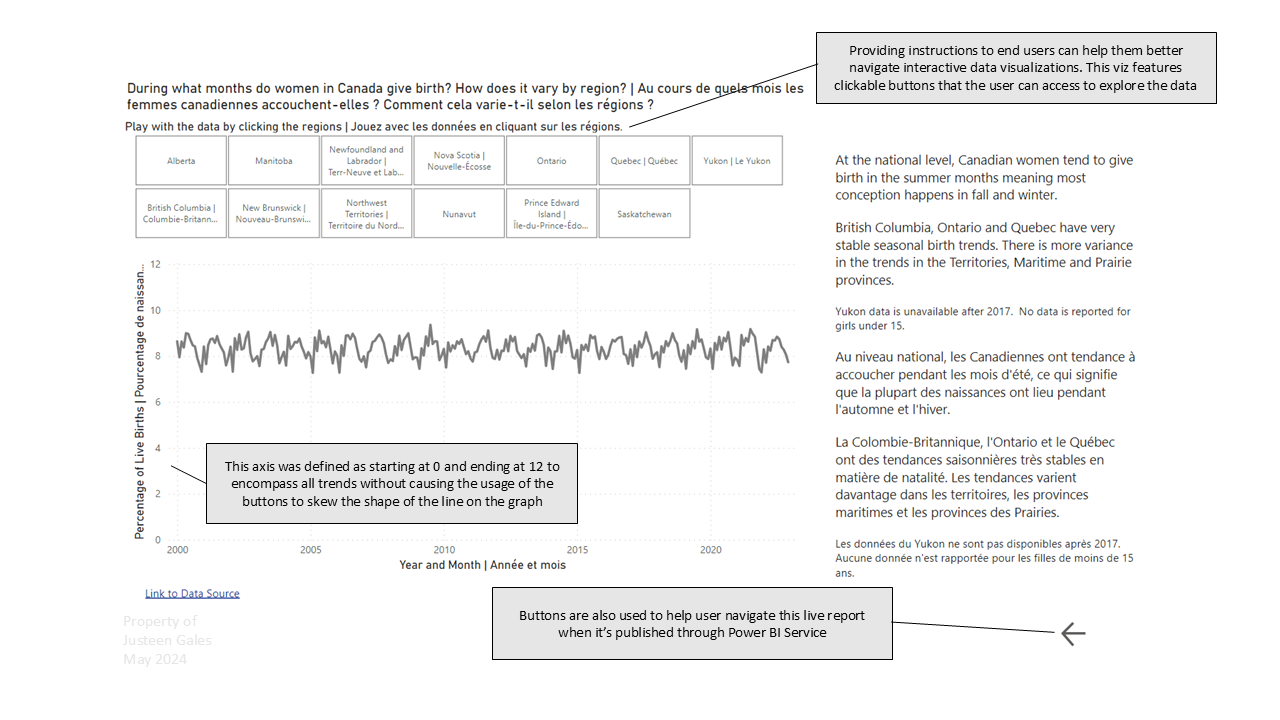
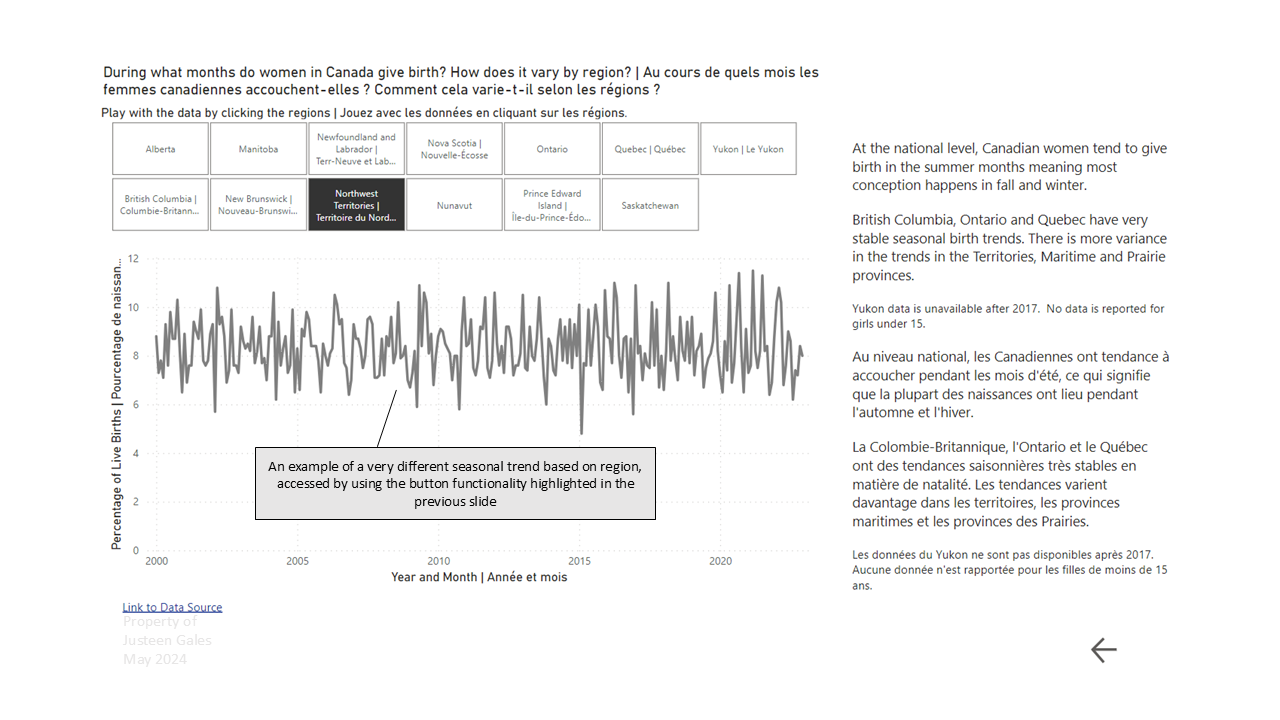
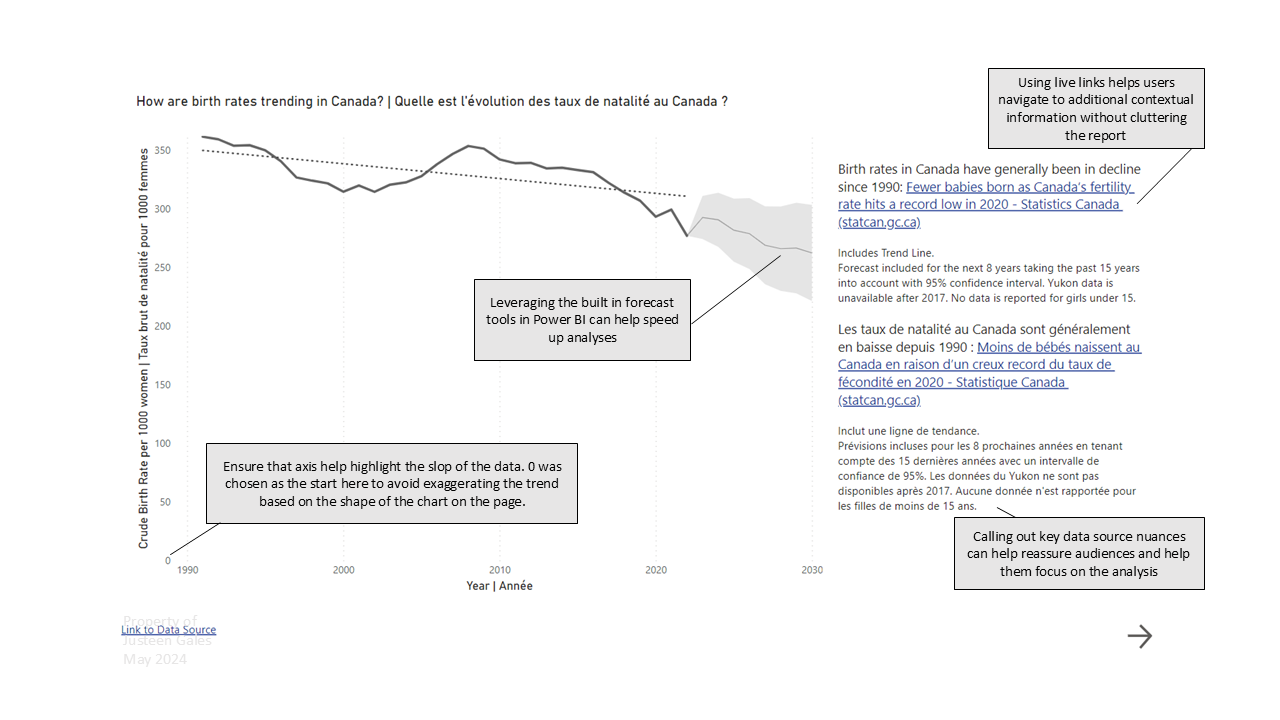
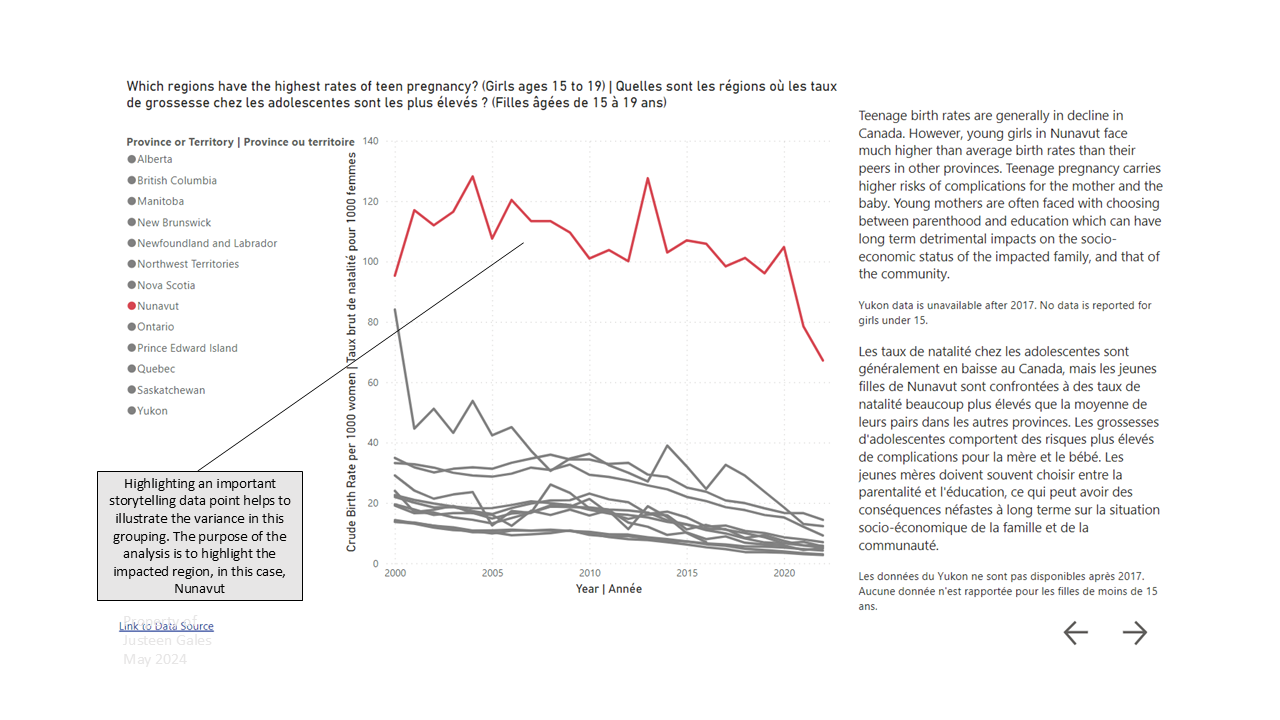
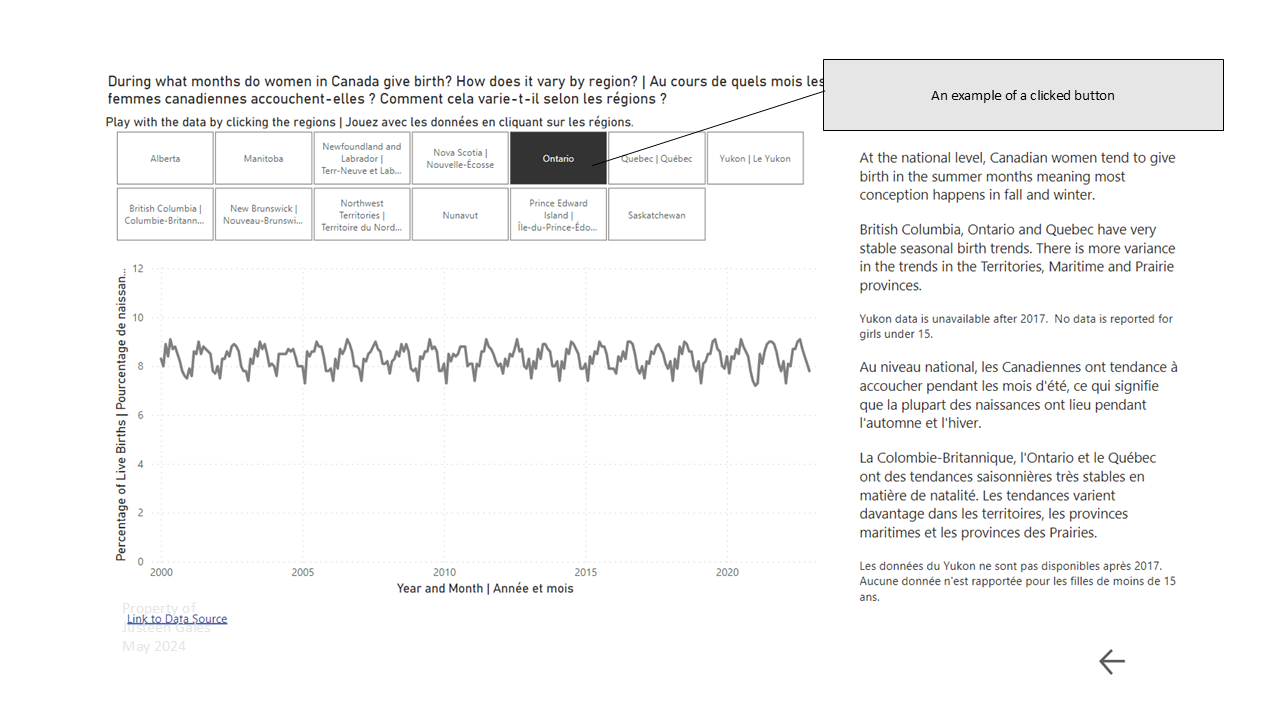
The visualizations below are examples of data storytelling with callouts to demonstrate the functionalities of Power BI. I use these visualizations to show how the different can functionalities help audiences understand the data better. I often use these types of simple visuals with storytelling to answer questions in a business context.
Data Sources:
Statistics Canada. Table 13-10-0418-01 Crude birth rate, age-specific fertility rates and total fertility rate (live births)
Statistics Canada. Table 13-10-0415-01 Live births, by month
Client
Personal Project
Year
May 2024