Data Viz: Exploring Data Hierarchies with JavaScript
I don’t know how to write JavaScript. But I can appreciate when someone has built an interesting data visualisation. Over at the National Library of Medicine in the USA, there is a cool interactive tree map that allows you to move through different genome groups and explore associated data. I enjoyed interacting with the visual. Maybe it will inspire you to try something new.
Link to Parent Site: National Center for Biotechnology Information
Link to Visual: NCBI Genome Data Viewer
Tree Mapping and Hierarchy Mapping Resources:
6 Hierarchical Data Visualizations | Towards Data Science
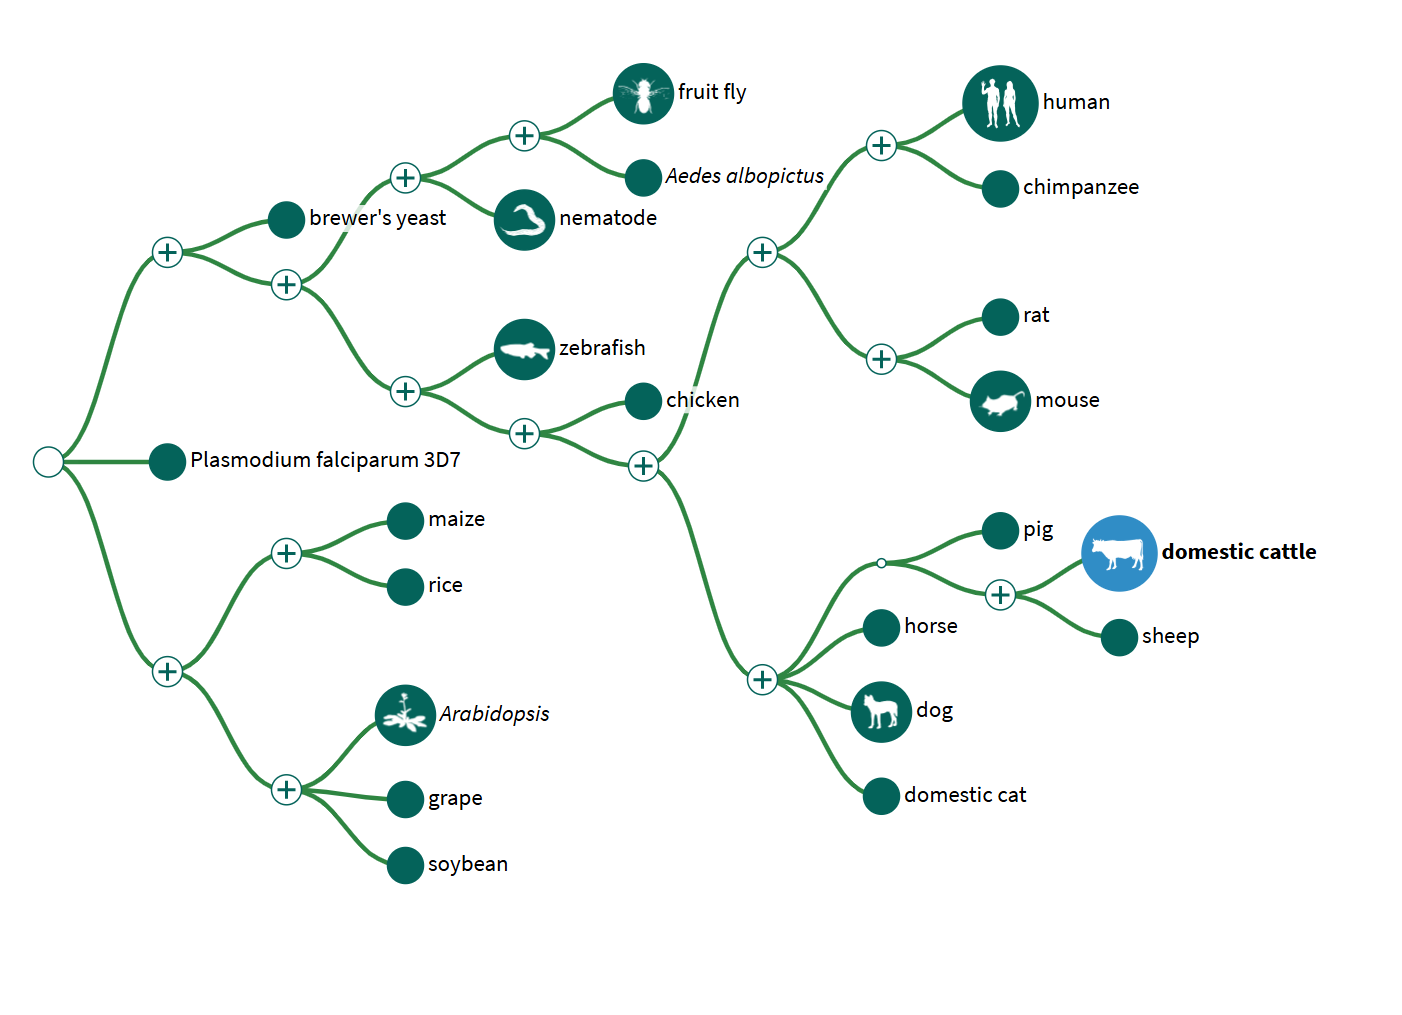
A still image preview of the interactive visual. Click the visual to explore the data.